
Thermal drone inspection and solar cleaning: from evidence to a targeted campaign
A credible cleaning program starts by separating uniform dust, localized contamination, shading, and electrical anomalies—then assigning the right field response to each condition.
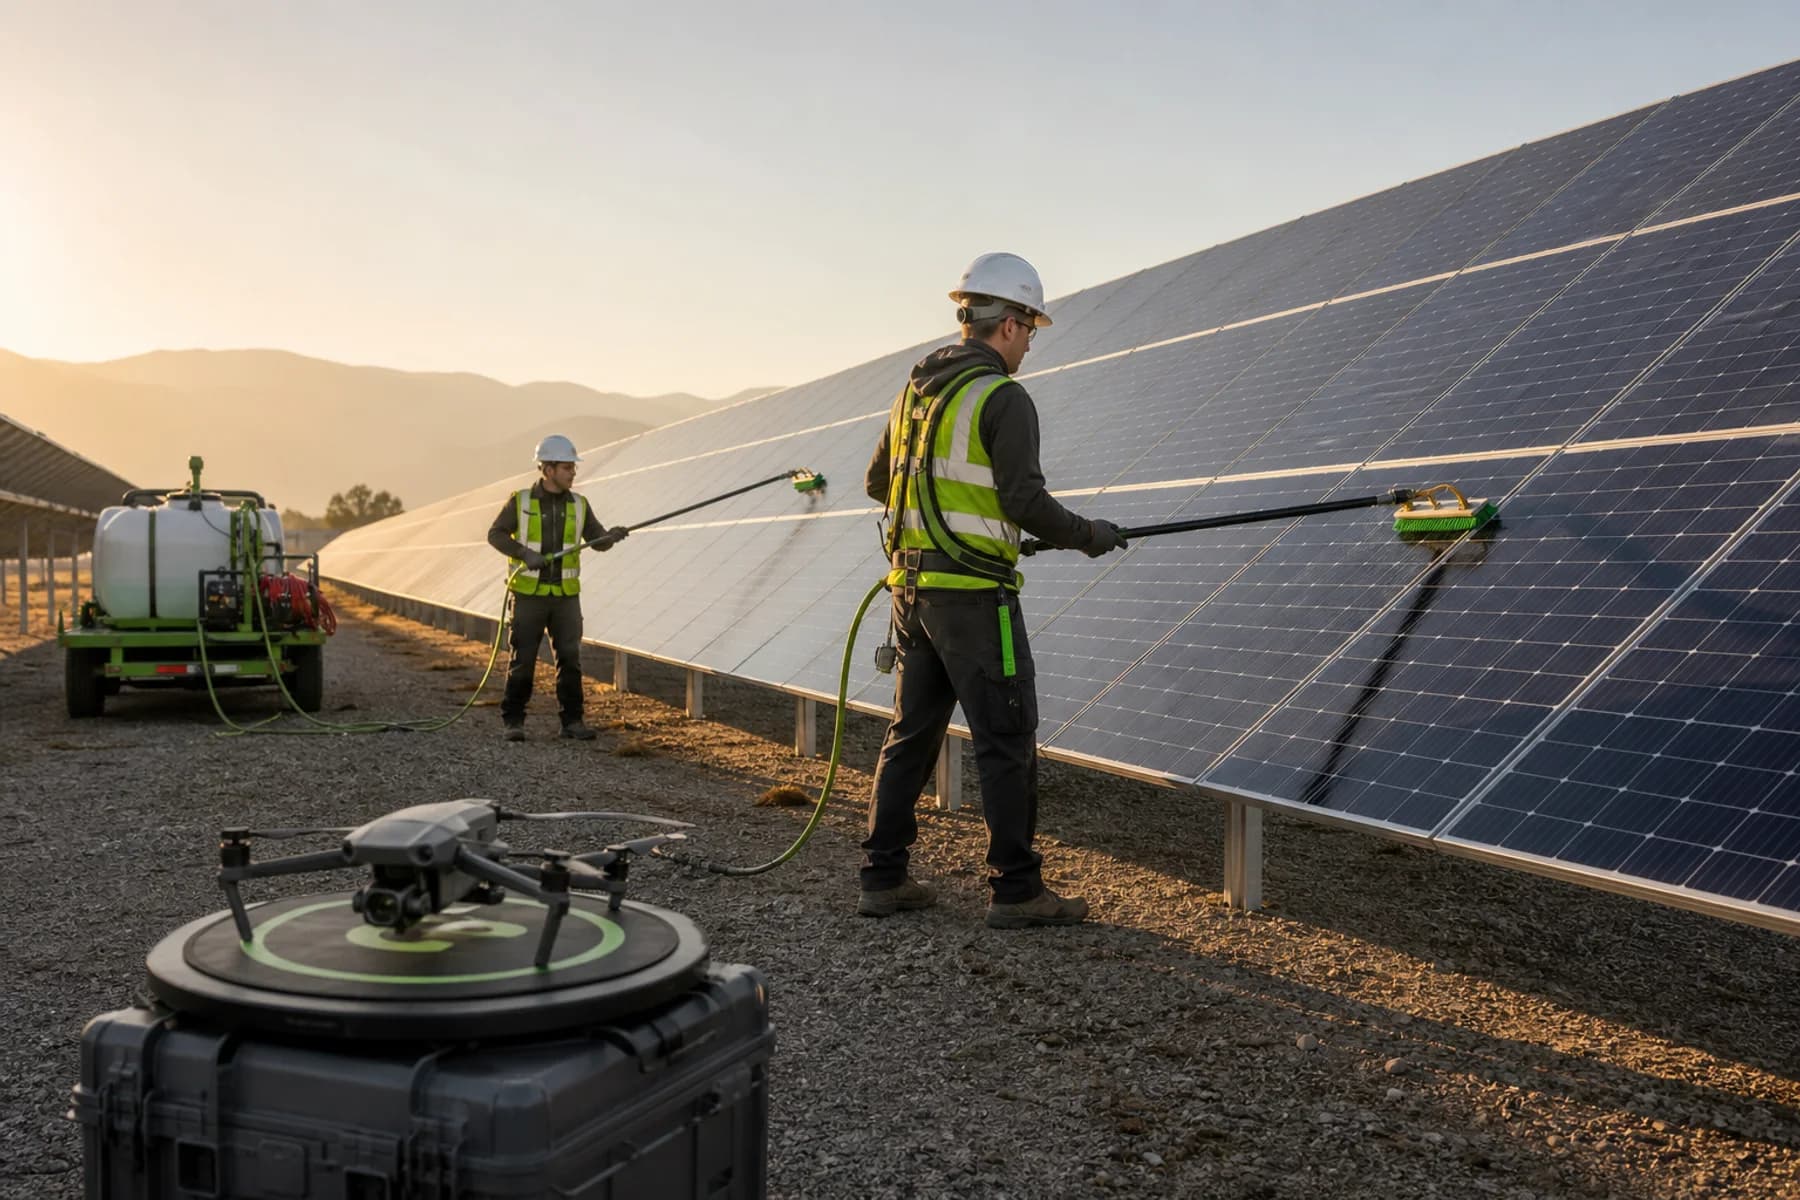
Utility-scale PV sites rarely soil evenly. Wind direction, road traffic, agricultural activity, panel tilt, drainage, bird activity, and vegetation can create very different conditions across a single plant. Cleaning every row on the same schedule may be simple, but it can consume water, labor, and access time where the operational value is limited.
A combined RGB, radiometric thermal, and performance-data workflow gives O&M teams a stronger basis for deciding where to inspect more closely, where to clean first, and where cleaning will not resolve the underlying issue. The drone is the inspection and data-collection tool; approved field teams carry out the cleaning and electrical work.
Start with conditions that make the data useful
Radiometric thermal inspection is most useful when the plant is operating and environmental conditions are sufficiently stable for meaningful comparison. Flight planning should account for irradiance, wind, cloud movement, module orientation, row spacing, safe altitude, and the asset hierarchy used by the maintenance team.
RGB capture should be planned alongside thermal capture. High-resolution visual evidence helps distinguish dirt, vegetation shadow, cracked glass, displaced hardware, cabling concerns, and other visible conditions that can resemble or contribute to thermal patterns.
- Confirm array blocks, inverter boundaries, tracker state, and known outages before flight.
- Use repeatable overlap, altitude, camera angle, and naming conventions.
- Record operating and weather context with the inspection dataset.
Separate cleaning candidates from electrical anomalies
A warm area is not automatically a cleaning issue. Localized cell heating, bypass-diode patterns, junction-box heating, string behavior, shading, and surface contamination can produce different signatures. ML/DL computer vision can group recurring patterns and accelerate review, but engineering context remains essential before assigning a cause or work order.
Cleaning intelligence is strongest when spatial RGB observations are compared with thermal evidence and available inverter, combiner, or string performance data. This allows teams to prioritize zones where contamination is visible and operationally relevant while routing suspected electrical defects into a separate maintenance path.
Build a practical cleaning priority map
The output should identify the affected block or row, evidence type, likely operational relevance, access constraints, and recommended action. Grouping adjacent rows into executable work packages reduces repeated mobilization and makes water, equipment, and crew planning more predictable.
- Immediate localized cleaning where contamination is concentrated and performance impact is plausible.
- Scheduled zone cleaning where soiling is broader but does not justify urgent mobilization.
- Monitor-only areas where evidence is weak or expected recovery is marginal.
- Engineering or electrical review where the pattern is unlikely to be solved by cleaning.
Close the loop with verification
Post-work capture confirms whether the visible condition was removed and whether the thermal pattern changed under comparable conditions. It also provides a defensible record for operations, contractors, asset owners, and warranty discussions.
Over several cycles, this evidence creates a site-specific cleaning strategy based on how contamination actually develops—not a generic calendar interval. The most valuable outcome is a repeatable decision process that connects inspection evidence to field action and measured closeout.
Operational perspectiveThermal drones do not replace engineering judgment or field crews. They make the cleaning and maintenance program more selective, traceable, and easier to verify.